Charting The Financial Stocks, XLF Likely Headed Lower

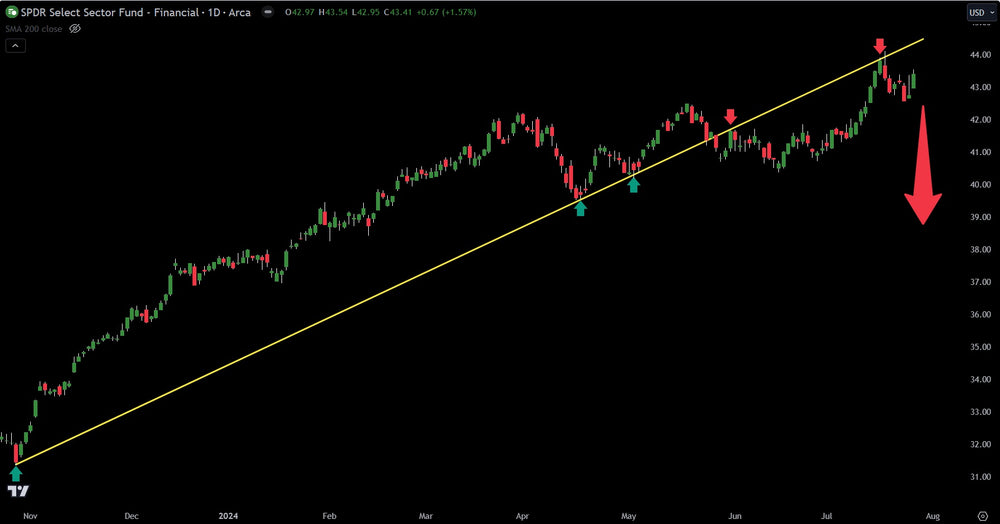
The financial ETF (XLF) has broken a key up-sloping pivot line.
A pivot line is defined by this: When price is above the line, a bullish bias is taken as price favors the upside. When price is below the pivot line, price favors the downside.
Notice in the chart above how everytime the XLF was above the line and fell into the line, price bounced higher, until finally it broke.
Now notice how when it hits the line from underneath, it falls back. This tells a technical investor a lot about the probability of the next move. Because it is below the pivot line, the probability favors the downside on the financial ETF. Technical analysis is signaling a bearish stance on the XLF in the near-term.
Downside support on the XLF is at $39.50, followed by $37.00.
Trading involves substantial risk. All content is for educational purposes only and should not be considered financial advice or recommendations to buy or sell any asset. Read full terms of service.


