Ethereum Chart Analysis: Price Digestion Continues For Investors
Cryptocurrency Ethereum continued to chop sideways over the last week as buyers and sellers cancel each other out. Following the Ethereum pop into SEC etf approval, price has fallen back as investors await the next catalyst.
Technical Factors
Ethereum dipped during the week to a low of $3,235. It quickly recovered intra-day. From a technical analysis standpoint, Ethereum hit a Fibonacci 0.618% retrace on that key dip. This is taking into account the low on May 15th to the high on May 27th. The low on May 15th was the beginning of the ETF pump while the high on May 27th was the recent high.
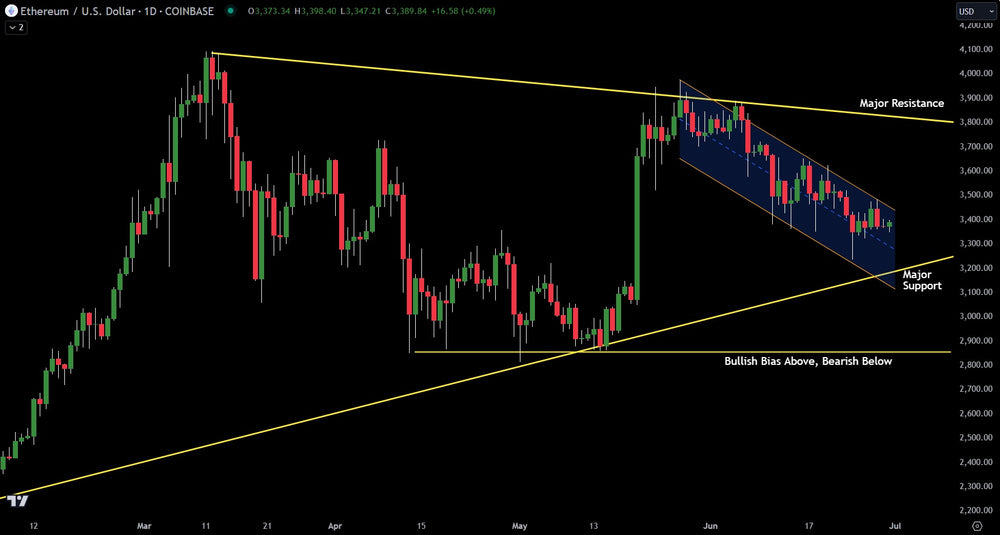
Ethereum is also trading in a downsloping channel as seen by the chart above. This is generally what happens during consolidation periods. Notice the major resistance trend line and the major support trend line in the chart above. Should price breakout of the channel, Ethereum would likely head to that major resistance trend line before running into resistance. Should price continue to go lower within the channel, buyers may be able to scoop up Ethereum at the lower support trend line of $3,150.
Summary
Ultimately, as long as Ethereum holds the low of the ETF bull move at $2,850, an overall bullish bias can remain. However, should that level break, a strong negative bias would take over.
Trading involves substantial risk. All content is for educational purposes only and should not be considered financial advice or recommendations to buy or sell any asset. Read full terms of service.