Ethereum Wedge Means Big Move Coming
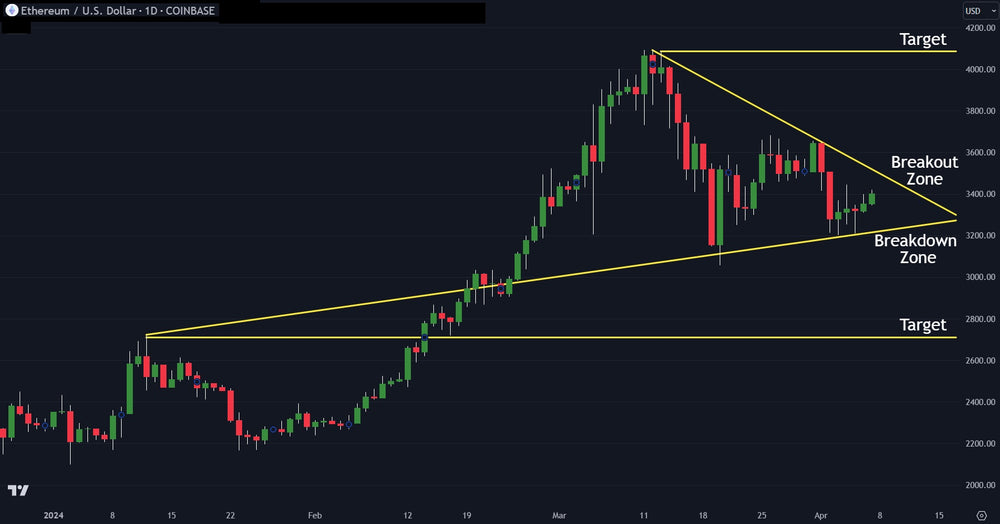
Ethereum is showing a wedge pattern formation. A wedge pattern is sideways chop where the lower highs connect with a trend line and the higher lows also connect with a trend line. In technical analysis, this signals investors are deciding which way to take price in a significant move.
Should the wedge break to the downside, Ethereum would likely see $2,700. Should it break to the upside, the double top at $4,000 would likely be seen.
The best investors and traders in the world follow technical analysis for near-term moves. They are unbiased and let the charts tell them which direction is likely. Remember, everything in technical analysis is about probabilities, nothing is a certainty.
Trading involves substantial risk. All content is for educational purposes only and should not be considered financial advice or recommendations to buy or sell any asset. Read full terms of service.