Technical Analysis Deep Dive On Ethereum
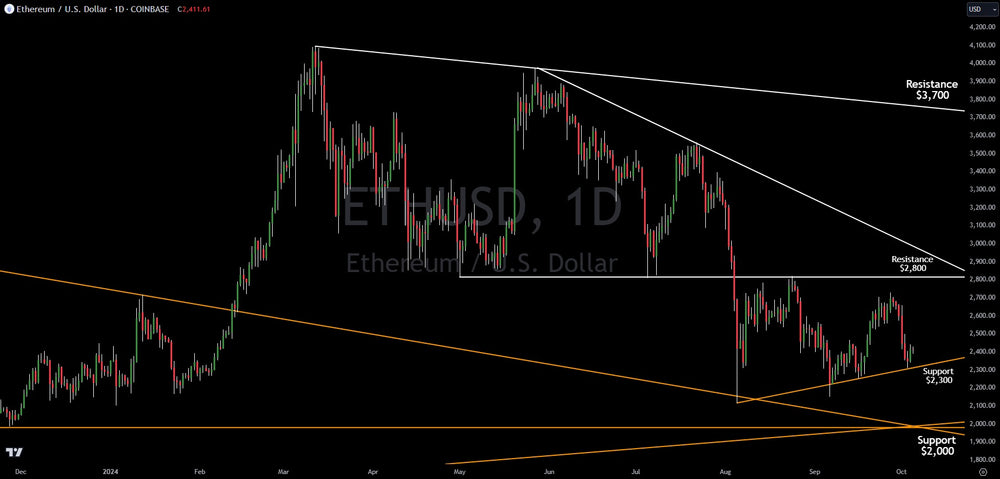
Ethereum struggled in the latest week of trading, falling nearly 10%. Per the last update, investors were aware that Ethereum had been lagging Bitcoin, still trading below the major pivot line at $2,800. This put it in a weak position and it did not disappoint.
Ethereum fell to $2,300, tagging support. It has had a small bounce off this level. Considering the stock market remains near all-time highs, the performance of Ethereum is still poor.
Ethereum's technical chart bias remains negative. Should it break $2,300, there is no major support until $2,000-$1,900. However, this chart level has multiple trend lines converging which likely makes it a strong buy when hit.
Should Ethereum defy the odds and rally higher, there is major resistance at $2,800. There are two trend lines converging in this zone. This is the bullish/bearish pivot zone. If it can manage a break of that area, there is no major resistance until $3,700.
Investors should remain skeptical on Ethereum in the near-term. The price action has been poor compared to Bitcoin. The technical probabilities signal a buy between $1,900 and $2,000 for a major bounce.
Verified Investing analyzes the data and charts to give non-biased, probability based research. We encourage investors to ignore the narratives in the mainstream media and the hype on social media. Getting rid of those and focusing on charts will make an investor much more profitable.
This article is intended for informational and educational purposes only and does not constitute financial advice. All trading involves risk. Past performance is not indicative of future results.
Trading involves substantial risk. All content is for educational purposes only and should not be considered financial advice or recommendations to buy or sell any asset. Read full terms of service.