Investor Alert: Bitcoin Chart Analysis With Key Support Levels
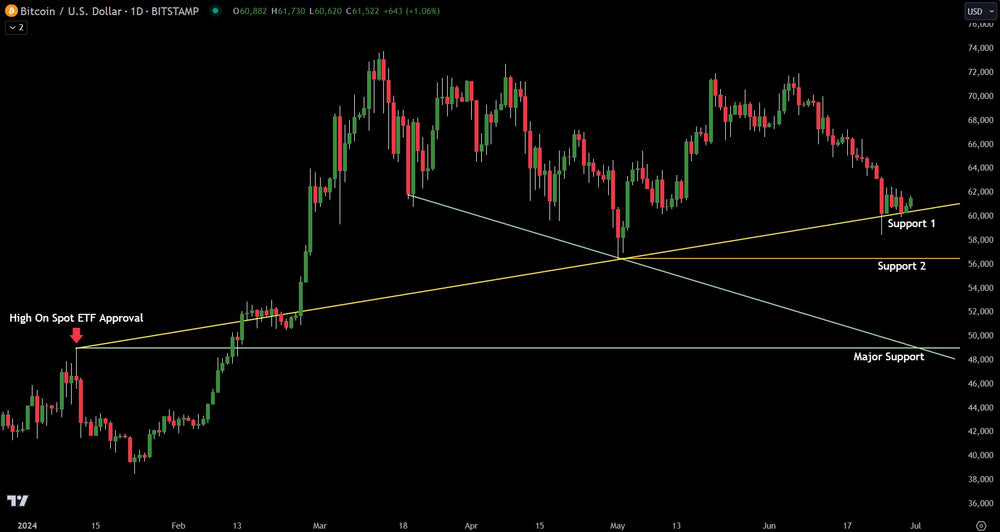
Bitcoin, the biggest market cap crytpocurrency held key support in the latest week of trading. After falling from its all-time high near $74,000 price is stabilizing. This can be seen in the chart above with price holding the 'Support 1' level. However, investors should be aware that the sideways chop on this support zone is considered bearish consolidation. This means the probability of further downside is greater than 50%.
Should Bitcoin break Support 1, it has secondary support at $56,500. This would be an area where another bounce is likely. Once hit, technical traders will start watching the pattern formation to see if it is a bear flag or a reversal pattern (bullish).
Utlimately, should Bitcoin fall to $49,000-$50,000, there are multiple major levels of support. This has a better chance of being a major pivot low.
Positive And Negative Of Bitcoin
Positive - Bitcoin is being adopted by more and more people. Volatility is coming down which is a good thing. Ultimately, Bitcoin has the potential to be a digital gold. With a global debt crisis looming, Bitcoin could be a major store of value.
Negtative - Bitcoin is still not that store of value and tends to trade like a risk asset. This means that if the stock market falls sharply, Bitcoin could also fall sharply. Considering the valuation in the stock market has reached stretched levels, Bitcoin does have risk over the next 12 months of going lower. Watch the $49,000-$50,000 level. if that breaks, $30,000 is a possible target.
This article is intended for informational and educational purposes only and does not constitute financial advice. All trading involves risk. Past performance is not indicative of future results.
Trading involves substantial risk. All content is for educational purposes only and should not be considered financial advice or recommendations to buy or sell any asset. Read full terms of service.