Technical Analysis: Ethereum Probabilities And Targets

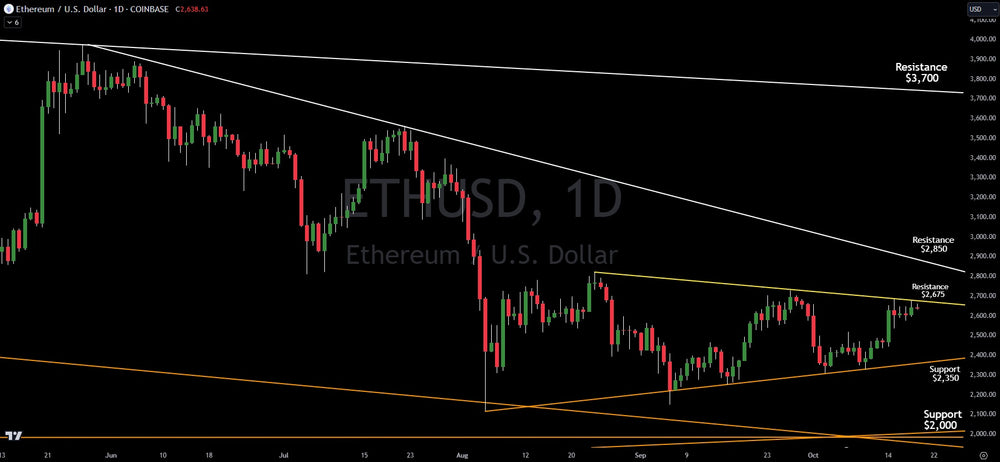
Cryptocurrency Ethereum started the past week with a solid push to the upside. However, it quickly ran into resistance at the $2,675 resistance level. Over the following five trading days it chopped sideways.
In technical analysis, sideways chop following a move up is known as bullish consolidation. This may mean it breaks through the $2,675 resistance in the coming week and pushes up to resistance at $2,875.
Should the bull flag fail, price would be expected to fall quickly to $2,350. Should that level break, the $1,900-$2,000 level is major support and would be a high probability buy level.
On the upside, if the bull flag plays out, resistance is $2,850 and beyond that, a potential mega run to $3,700 could occur.
Looking strictly at the chart and pattern formation, odds favor a breakout to at least $2,850. One of the key things investors should watch continues to be the stock market. As long as equity markets continue to make new all-time highs, crypto should do very well and eventually Ethereum would play catch up to Bitcoin. Altcoins overall have dramatically lagged Bitcoin as Bitcoin dominance has continued to increase.
Verified Investing is here to give retail investors the same information that the institutions pay technical analysts millions for. Verified Investing is about evening the playing field and helping investors make decisions based on data and probability. While most investors are ruled by emotion from narratives spun by the mainstream media and hype from social media, Verified Investing is giving them an alternative.
Trading involves substantial risk. All content is for educational purposes only and should not be considered financial advice or recommendations to buy or sell any asset. Read full terms of service.


